Biacore X100 reference portal
Assay setup for concentration analysis
For concentration assays with macromolecular ligands and analytes, immobilize as much ligand as is reasonably possible. For protein ligands of average molecular size (of the order of 50,000–150,000 daltons), immobilization levels of 10,000–15,000 RU are typical. The analyte binding response at a given sample concentration is directly related to the level of immobilized ligand, so that a high immobilization level will enable measurements at lower analyte concentrations.
If the ligand is large and the analyteis small, responses will generally be low so that the sensitivity of a direct concentration assay may be limited even at high ligand immobilization levels (20,000 RU or higher). Concentration assays for small molecules are generally better designed as inhibition assays to overcome this limitation.
If the ligand is small and the analyte is large, it may be necessary to moderate the amount of ligand immobilized in order to avoid steric crowding effects at high analyte concentrations. This is also true for assays that use capturing or enhancement reagents, where a multi-molecular complex is built up on the sensor surface during the course of an assay. If several of the components are large, high levels of immobilized ligand can result in crowding and steric hindrance between binding molecules at a subsequent stage in the assay, limiting the observed response.
There are many well-established ways of measuring concentration. What advantages can Biacore-based assays provide over conventional interaction-based methods?
The principles of concentration measurement with Biacore are largely similar to established interaction methods such as ELISA, except that in Biacore the extent of interaction is measured directly, allowing rate-based as well as end-point measurements. Another major difference between Biacore and other methods lies in the real-time, label-free aspects of the measurement. A Biacore-based assay continuously monitors each binding step in the assay procedure, in contrast to many other techniques that only measure the end-point level of the final interactant. A direct comparison of antibody-based assays in Biacore and in an ELISA format reveals a number of advantages with Biacore:
- Assay procedures for ELISA involve a number of washing steps, where analyte that dissociates from the detecting molecule can be lost. Biacore detects the analyte directly. Because of this, only high-affinity antibodies are suitable for ELISA, whereas Biacore makes less stringent demands on the properties of the detecting molecule.
- ELISA assays require additional steps using secondary reagents to measure the amount of antibody-antigen complex formed on the ELISA plate. Biacore measures the amount directly and requires no additional reagents, although additional reagents may beexploited to enhance the assay.
- The result of an ELISA assay is only seen after the final step. Biacore monitors each step in the process, providing quality control of the assay procedure even if only a single time point is actually usedfor the concentration determination.
Another advantage inherent in the detection method is that the measurements are non-invasive. Although the detection technology is optical in character, the light does not actually penetrate the sample. In consequence, there is no interference from absorption by colored samples or light scattering by turbid samples. Even samples such as whole blood and milk can be analyzed with the same precision as clear and colorless solutions.
Most Biacore systems support concentration measurements using known standards to create a calibration curve. Some new systems also provide support for calibration-free concentration analysis (CFCA), which determines sample concentration from the rate of diffusion-limited analyte binding, and does not require a calibration curve.
Binding level assays represent the most direct approach to measuring concentration with Biacore. The detecting molecule is attached to the sensor chip surface: sample is injected, and the response obtained after a fixed contact time is measured. The response is related to analyte concentration with the help of a standard curve, prepared by analyzing known concentrations of analyte under the same conditions.
Single step direct measurement
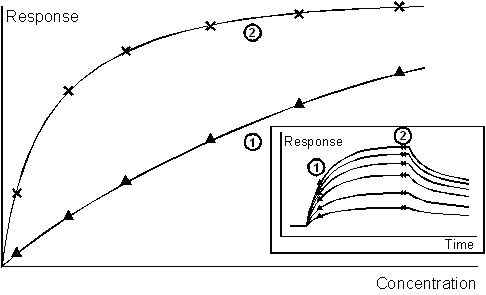
Direct measurement is suitable for macromolecular analytes (molecular weight > 5000 daltons) which give an easily measured response even at low molar concentrations. During injection of sample, the response increases as a function of time as analyte binds to the surface, reaching a steady state value if the contact time is sufficiently long. Depending on the time at which the response is measured, the sensitivity and operating range of the assay will be different.

A single step direct assay gives an increasing response with increasing concentration. The range and sensitivity are determined in part by the time at which the response is measured: an interaction that is allowed to approach equilibrium will give a higher sensitivity at low analyte concentrations. The inset shows the sensorgrams from which the calibration curves are derived.
This feature illustrates one of the advantages of Biacore assays over many conventional end-point determinations. Since the measurement can be taken before the interaction has reached equilibrium, assay cycle times can be kept short and the operating range of the assay can be optimized to some degree. The limiting factor in one direction is the reliability and precision with which low responses can be measured after short contact times. In practice, the response should be measured at least 5-10 seconds after the start of sample injection to avoid disturbances in the sensorgram associated with the switch from running buffer to sample. In the other direction, the operating range is limited by the affinity of the detecting molecule for analyte. At equilibrium (assuming a 1:1 interaction), an analyte concentration equal to the equilibrium dissociation constant (KD) will give 50% saturation of the surface, and the assay will be useful over one or two orders of magnitude below this concentration. For measurement of lower concentrations, a detecting molecule with a higher affinity (lower KD) should be sought.
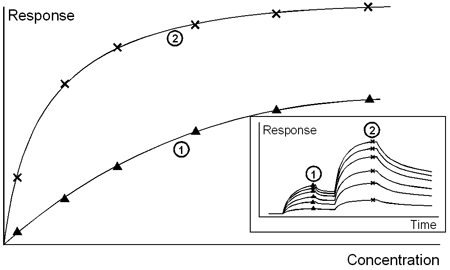
Sandwich methods are an extension of the single step direct approach: after analyte has bound to the surface-attached ligand, a secondary interactant (the enhancement molecule) is injected to bind to the analyte and enhance the analyte response. If the secondary analyte is a larger molecule than the analyte, the secondary response will be proportionally higher than the primary response obtained from the analyte itself, providing an amplification of the signal.

Sensorgrams (inset) and calibration curves for a direct binding assay with enhancement. 1: primary response (analyte), 2: secondary response (enhancement reagent).
In addition to the signal amplification which can improve the limits of detection and quantitation, sandwich methods can provide enhanced specificity, since the measured secondary response reflects the combined specificities of analyte binding to detecting molecule and to secondary interactant. This can be valuable in measuring concentrations in complex mixtures, where the secondary response confirms the identity of the molecule detected in the first interaction. It also finds application in measuring the concentration of bifunctional molecules, in particular recombinant tagged proteins where one interaction may be directed against the tag and the second interaction identifies the target molecule.
A prerequisite for sandwich methods is that the analyte has distinct, non-interfering binding sites for the detecting molecule and the secondary interactant. In practice, this restricts the usefulness of the approach to macromolecular analytes.
Sandwich assays are part of the standard repertoire of immunological assay techniques in other formats such as RIA and ELISA. However, these techniques only measure the secondary interactant (the radio- or enzyme-labeled antibody that detects analyte bound to the immunoassay substrate). A significant difference in the Biacore approach is that binding data are obtained automatically for both the primary and secondary interactions. It is therefore a simple matter to construct standard curves based on both primary and secondary responses, which provides additional information concerning the specificity of the interactions used.
The response obtained in Biacore systems is a measure of the change in mass concentration of solutes close to the sensor surface. Accordingly, low molecular weight (LMW) analytes give a lower response than macromolecules for an equivalent molar concentration. While binding of molecules as small as 200 daltons can be observed in Biacore under favorable circumstances, the usefulness of direct binding level assays for measuring the concentration of small molecules is limited. Indirect assays represent an alternative approach in such cases.
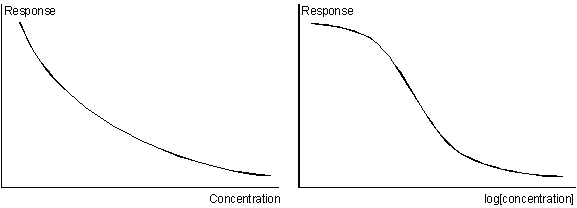
Competition assays work on the principle of allowing a high molecular weight (HMW) detecting molecule to bind to the sensor surface in competition with the analyte. The response, which measures the amount of HMW molecule bound, gives an inverse measure of the concentration of analyte in the sample. Two different formats are generally recognized, according to whether the detecting molecule is in solution or on the surface.
Inhibition assays
Inhibition assays, also called solution competition, exploit the ability of the analyte to inhibit the binding of HMW detecting molecule to the surface. Typically, the analyte or a derivative thereof is attached to the surface as the ligand, while the detecting molecule is a macromolecule that binds specifically to the analyte. A constant, known amount of detecting molecule is added to the samples. The mixture may be incubated to reach equilibrium if required, and is then injected over the sensor surface to measure the remaining free detecting molecule. The amount of free detecting molecule is inversely related to the concentration of analyte in the sample.

Inhibition and surface competition assays give a calibration curve where the response is inversely related to the analyte concentration. Calibration curves are often shown on a log[concentration] scale (right panel) to expand the low concentration region.
Clearly, it is essential that detecting molecules carrying bound analyte in solution should not be able to bind to the surface-attached ligand. Ideally, the HMW detecting molecule should be monovalent for this reason. However, monoclonal antibodies are commonly used as detecting molecules, in spite of their bivalent binding properties. Even though both antigen-binding sites must be occupied to effectively inhibit the binding of antibody to the surface, the inhibition assay principle still works reliably and antibodies are often the most readily available source of detecting molecules.
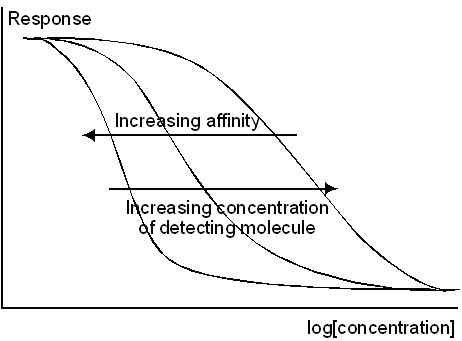
The affinity of the detecting molecule for the analyte in solution together with the concentration of detecting molecule determines the useful range of an inhibition assay. Higher affinities allow measurement at lower analyte concentrations but also result in a narrower operating range. In formal terms, the IC50 of an inhibition assay is given by
![]()
where KD is the equilibrium dissociation constant for the interaction with analyte and C is the total concentration of detecting molecule. If the concentration is much smaller than the dissociation constant, the range will be determined primarily by the affinity: conversely, if the concentration is much higher than the dissociation constant, the range will be determined primarily by the concentration.

Increasing the affinity of the detecting molecule moves the operating range to lower analyte concentration and also narrows the range.
Inhibition assays are most commonly used for LMW analytes. They may however also be used as an alternative to direct binding level assays for macromolecular analytes, in situations where immobilization or regeneration of the detecting molecule on the sensor surface is not satisfactory.
Biacore systems offer a number of different approaches to measuring concentration. The choice of approach is dictated largely by the characteristics of the analyte being assayed, and to some extent by the purpose of the assay and the type of sample matrix that will be used. The table below provides some general guidelines.
|
|
|
|
Macromolecules
(typically MW >5000 daltons) |
Direct binding assay Read more: |
|
Small molecules
(typically MW <5000 daltons) |
|
|
Small molecules which are difficult to attach to the sensor surface
|
|
|
|
|
Most commonly, antibodies are chosen as detecting molecule because they are readily available, specific for the analyte, and offer a range of affinities for adjusting the operating range of the assay. However, the concentration measured by an antibody-based assay is the antigenic concentration of the analyte, which may be influenced by factors such as epitope specificity and cross-reactivity. Sometimes, depending on the purpose of the assay, it may be more suitable to choose a detecting molecule related to the functional activity of the analyte.
Binding rate measurements
Binding rate measurements are a form of direct binding assay that exploits the ability of Biacore systems to monitor complex formation continuously as a function of time. The rate of binding of analyte to the detecting molecule is related to the analyte concentration in the sample. Under suitably designed circumstances, this approach is independent of the affinity between analyte and detecting molecule, and can even be used to measure concentration in the absence of a standard curve.
Although aspects of assay development are considered in separate sections in this chapter and are generally approached with separate experimental design in practice, the process of development should result in an assay that meets all requirements at the same time. In many cases, compromises between different requirements may be necessary. For example a detecting molecule that gives an assay with an excellent range may be unsatisfactory in terms of specificity, while an alternative molecule that has acceptable specificity may be inferior in terms of range. Development of an assay is an iterative process of refinement, and it is often most useful to test all requirement aspects roughly before proceeding to optimize each aspect. In that way, the risk is reduced that work put in to optimizing one aspect may be wasted when another aspect proves unsatisfactory.
Assay requirement specification
As a prelude to development of a concentration assay, an assay requirement specification should be established, detailing the demands that the assay is required to meet. The goal of assay development is then to meet the requirement specification. In general, an assay requirement specification should define, in as much detail as possible, the acceptable range of values for each of the performance parameters that is relevant to the assay in question.
General practical considerations
Preparing samples
Concentration assays using Biacore rely on specific interaction between the analyte and detecting molecule, and the SPR detection technology allows measurements to be made on colored or turbid (even opaque) samples. In consequence, sample preparation is often greatly simplified in comparison with many other established techniques for concentration determination.
Bear in mind the following points with respect to sample preparation:
- Although measurements can be made on turbid and opaque samples, repeated injection of particulate suspensions can lead to problems with the flow system in Biacore. Samples in complex matrices should be centrifuged (e.g. 15,000 g for 10 minutes) or filtered (0.22 µm filter) if possible before analysis.
- Some kind of extraction procedure is necessary for measurements on solid or particulate matrices. If extraction is performed using organic solvents, extracts will need to be transferred to water-based media before analysis. Refer to the chemical resistance information for the Biacore system for compatibility of the flow system and sensor surface with organic solvents.
- Partial purification or fractionation of samples or extracts may be necessary to eliminate non-specific binding or matrix interference effects. Use standard fractionation procedures appropriate for the analyte being measured.
Buffers used in preparation of samples and running buffer for the assay should be thoroughly degassed if the system does not include an integrated degasser unit, to avoid formation of air bubbles in the flow system during the run.
See also
Calibration curves for concentration measurement
Calibration-free concentration analysis (CFCA)
Operating range for direct binding assay
Operating range for inhibition assay
Choice of ligand and reagents for inhibition assay
Report point position for concentration measurements
Panel 2 header
Lorem ipsum dolor sit amet, consectetur adipisicing elit. Repellendus aliquid tempore natus voluptates repudiandae, eos dolorem libero inventore, quod incidunt, asperiores. Reiciendis itaque enim pariatur, blanditiis minima autem quo a nulla, obcaecati quis, excepturi atque ab rerum! Sequi molestias vel eum, hic, perspiciatis eius suscipit reprehenderit molestiae vitae similique.
Panel 3 header
Lorem ipsum dolor sit amet, consectetur adipisicing elit. Repellendus aliquid tempore natus voluptates repudiandae, eos dolorem libero inventore, quod incidunt, asperiores. Reiciendis itaque enim pariatur, blanditiis minima autem quo a nulla, obcaecati quis, excepturi atque ab rerum! Sequi molestias vel eum, hic, perspiciatis eius suscipit reprehenderit molestiae vitae similique.

Panel 4 header
Lorem ipsum dolor sit amet, consectetur adipisicing elit. Repellendus aliquid tempore natus voluptates repudiandae, eos dolorem libero inventore, quod incidunt, asperiores. Reiciendis itaque enim pariatur, blanditiis minima autem quo a nulla, obcaecati quis, excepturi atque ab rerum! Sequi molestias vel eum, hic, perspiciatis eius suscipit reprehenderit molestiae vitae similique.
Panel 4 header 2
Lorem ipsum dolor sit amet, consectetur adipisicing elit. Repellendus aliquid tempore natus voluptates repudiandae, eos dolorem libero inventore, quod incidunt, asperiores. Reiciendis itaque enim pariatur, blanditiis minima autem quo a nulla, obcaecati quis, excepturi atque ab rerum! Sequi molestias vel eum, hic, perspiciatis eius suscipit reprehenderit molestiae vitae similique.
Panel 5 header
Lorem ipsum dolor sit amet, consectetur adipisicing elit. Repellendus aliquid tempore natus voluptates repudiandae, eos dolorem libero inventore, quod incidunt, asperiores. Reiciendis itaque enim pariatur, blanditiis minima autem quo a nulla, obcaecati quis, excepturi atque ab rerum! Sequi molestias vel eum, hic, perspiciatis eius suscipit reprehenderit molestiae vitae similique.
Panel 5 header 2
Lorem ipsum dolor sit amet, consectetur adipisicing elit. Repellendus aliquid tempore natus voluptates repudiandae, eos dolorem libero inventore, quod incidunt, asperiores. Reiciendis itaque enim pariatur, blanditiis minima autem quo a nulla, obcaecati quis, excepturi atque ab rerum! Sequi molestias vel eum, hic, perspiciatis eius suscipit reprehenderit molestiae vitae similique.
Panel 5 header 3
Lorem ipsum dolor sit amet, consectetur adipisicing elit. Repellendus aliquid tempore natus voluptates repudiandae, eos dolorem libero inventore, quod incidunt, asperiores. Reiciendis itaque enim pariatur, blanditiis minima autem quo a nulla, obcaecati quis, excepturi atque ab rerum! Sequi molestias vel eum, hic, perspiciatis eius suscipit reprehenderit molestiae vitae similique.