Biacore X100 reference portal
Calibration curves for concentration analysis
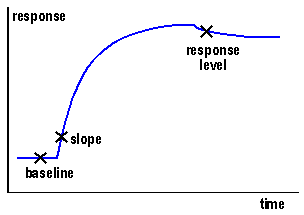
Calibration curves for concentration measurement in Biacore are constructed from the response obtained from calibration samples with known analyte concentration. The response may be measured as either sensorgram slope or response level at a fixed time, and the calibration curve may be fitted to the experimental points as either a straight line or a curve (using a 4-parameter fitting function).
Calibration samples
Most commonly, calibration samples consist of known concentrations of analyte in buffer.
If samples to be measured are in a defined and constant sample matrix, calibration samples can be prepared by adding known analyte concentrations to a blank matrix. The calibration curve will then compensate automatically for any effect of the sample matrix on the measurements.
When blank matrix is not available or the matrix composition is not constant (for example for concentration measurements in serum), allowances must be made for any effects of the sample matrix on the measurements. Such effects are most easily detected by measuring the concentration in pooled or randomly selected matrix samples spiked with analyte.
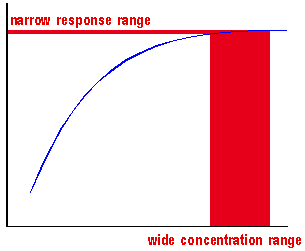
Calibration rangeThe limits of the calibration range are set by the lowest and highest concentrations of calibrant measured. Calibration curves are not mathematical functions and should not be extrapolated beyond the measured limits. Depending on the shape of the calibration curve, the useful range may be narrower than the measured limits. If the calibration curve flattens out too much at high concentrations, a narrow response range will correspond to a wide concentration range and the results will be uncertain. |
 |
|
 |
An alternative measure is the sensorgram slope during sample injection, measured at a fixed time after the start of the injection. With low flow rates and high levels of immobilized ligand, the slope early in the injection is often largely determined by the concentration and diffusion properties of the analyte and is independent of interaction kinetics. This approach can thus be used to estimate concentrations of molecules with similar physical properties but different interaction kinetics, such as monoclonal antibodies (see the article on Binding rate for more details).
Place report points for slope measurements shortly (10-20 seconds) after the start of the sample injection. Mass transport limitation is greatest at the start of the injection. Make sure the report point is not affected by any transient disturbances associated with the start of the injection.
Fitting function
Calibration curves for concentration measurement in Biacore are not usually linear, and are best fitted to a 4-parameter function. This is a general curve function that handles practically all calibration curves satisfactorily. If the 4-parameter fitting fails, this is generally because one or more points deviate widely from a smooth curve.

A linear fitting function may be used if there is a requirement (e.g. a regulatory compliance demand) that concentrations are determined from a straight line calibration. There is however no a priori reason to expect a linear calibration curve, and a linear function can often only be used over a limited section of the full potential range of the assay.
Calibration curve quality
Reliable measurement of unknown sample concentrations is strongly dependent on the accuracy of the calibration curve. In assessing the quality of the calibration, consider the following points:
- How well do the experimental points agree with the fitted curve? Unknown samples are determined from the fitted curve, and deviation of curve from the experimental points will introduce uncertainty in the measured values.
- How well do replicate calibration measurements agree? Again, discrepancies between the experimental points and the curve will introduce uncertainty.
- How correct are the measurements on control samples containing known analyte concentrations? Discrepancies between expected and measured concentrations may be introduced by sample matrix effects, or may indicate an inaccurate calibration curve.
Panel 2 header
Lorem ipsum dolor sit amet, consectetur adipisicing elit. Repellendus aliquid tempore natus voluptates repudiandae, eos dolorem libero inventore, quod incidunt, asperiores. Reiciendis itaque enim pariatur, blanditiis minima autem quo a nulla, obcaecati quis, excepturi atque ab rerum! Sequi molestias vel eum, hic, perspiciatis eius suscipit reprehenderit molestiae vitae similique.
Panel 3 header
Lorem ipsum dolor sit amet, consectetur adipisicing elit. Repellendus aliquid tempore natus voluptates repudiandae, eos dolorem libero inventore, quod incidunt, asperiores. Reiciendis itaque enim pariatur, blanditiis minima autem quo a nulla, obcaecati quis, excepturi atque ab rerum! Sequi molestias vel eum, hic, perspiciatis eius suscipit reprehenderit molestiae vitae similique.

Panel 4 header
Lorem ipsum dolor sit amet, consectetur adipisicing elit. Repellendus aliquid tempore natus voluptates repudiandae, eos dolorem libero inventore, quod incidunt, asperiores. Reiciendis itaque enim pariatur, blanditiis minima autem quo a nulla, obcaecati quis, excepturi atque ab rerum! Sequi molestias vel eum, hic, perspiciatis eius suscipit reprehenderit molestiae vitae similique.
Panel 4 header 2
Lorem ipsum dolor sit amet, consectetur adipisicing elit. Repellendus aliquid tempore natus voluptates repudiandae, eos dolorem libero inventore, quod incidunt, asperiores. Reiciendis itaque enim pariatur, blanditiis minima autem quo a nulla, obcaecati quis, excepturi atque ab rerum! Sequi molestias vel eum, hic, perspiciatis eius suscipit reprehenderit molestiae vitae similique.
Panel 5 header
Lorem ipsum dolor sit amet, consectetur adipisicing elit. Repellendus aliquid tempore natus voluptates repudiandae, eos dolorem libero inventore, quod incidunt, asperiores. Reiciendis itaque enim pariatur, blanditiis minima autem quo a nulla, obcaecati quis, excepturi atque ab rerum! Sequi molestias vel eum, hic, perspiciatis eius suscipit reprehenderit molestiae vitae similique.
Panel 5 header 2
Lorem ipsum dolor sit amet, consectetur adipisicing elit. Repellendus aliquid tempore natus voluptates repudiandae, eos dolorem libero inventore, quod incidunt, asperiores. Reiciendis itaque enim pariatur, blanditiis minima autem quo a nulla, obcaecati quis, excepturi atque ab rerum! Sequi molestias vel eum, hic, perspiciatis eius suscipit reprehenderit molestiae vitae similique.
Panel 5 header 3
Lorem ipsum dolor sit amet, consectetur adipisicing elit. Repellendus aliquid tempore natus voluptates repudiandae, eos dolorem libero inventore, quod incidunt, asperiores. Reiciendis itaque enim pariatur, blanditiis minima autem quo a nulla, obcaecati quis, excepturi atque ab rerum! Sequi molestias vel eum, hic, perspiciatis eius suscipit reprehenderit molestiae vitae similique.