Biacore X100 reference portal
Operating range for inhibition assay
The calibration curve for an inhibition assay is inverted in comparison with a direct assay, with the highest response at low analyte concentrations.
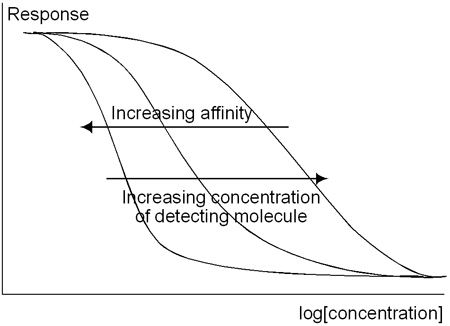
- The affinity of the detecting molecule for the analyte in solution together with the concentration of detecting molecule determine the useful range of an inhibition assay. Higher affinities allow measurement at lower analyte concentrations but also result in a narrower operating range. The relationship between affinity and range is more complex than for direct assays since the detecting molecule binds to analyte both on the surface and in solution, but the principle is similar.

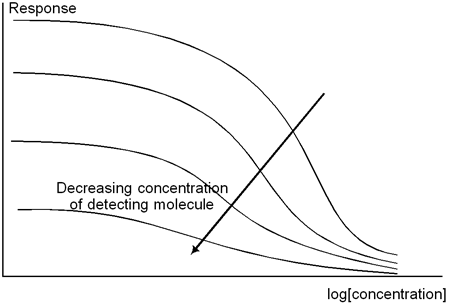
Increasing the affinity of the detecting molecule moves the operating range to lower analyte concentrations and also narrows the range. Increasing the concentration of detecting molecule moves the operating range to higher concentrations. - The concentration of detecting molecule affects the height of the curve on the response axis. Higher concentrations will compress the curve at high response levels, while lower concentrations will reduce the maximum response and potentially allow measurement at lower analyte concentrations.

- The contact time for the sample affects both the height and position of the calibration curve in the same way as for direct assays. Use a longer contact time to increase the response range. Combine a lower concentration of detecting molecule with a longer contact time to work with lower analyte concentrations.
Follow the steps below to find the best calibration curve that can be obtained for a given detecting molecule. The sensor surface must be prepared first by immobilization of analyte or analyte analogue.
- Inject the detecting molecule at a range of concentrations with no added analyte. Select the concentration that gives a suitable response level (approximately 100-2000 RU is recommended depending on the performance requirements) within a reasonably short contact time (1-2 min).
- Prepare a calibration curve using the selected concentration of detecting molecule with added analyte over at least the required operating range of the assay.
- If the calibration curve does not exploit the full response range (i.e. the highest concentration of analyte does not reduce the response to baseline), repeat the calibration curve using a lower concentration of detecting molecule and a longer contact time to compensate for the reduced maximum response.
- If you cannot meet the required assay specification by adjusting the concentration of detecting molecule and contact time for the injection, the affinity of the detecting molecule for analyte is probably too low. Review your choice of detecting molecule. In comparing calibration curves obtained with different detecting molecules, adjust the respective concentrations so that the maximum response level is comparable between different detecting molecules.
Panel 2 header
Lorem ipsum dolor sit amet, consectetur adipisicing elit. Repellendus aliquid tempore natus voluptates repudiandae, eos dolorem libero inventore, quod incidunt, asperiores. Reiciendis itaque enim pariatur, blanditiis minima autem quo a nulla, obcaecati quis, excepturi atque ab rerum! Sequi molestias vel eum, hic, perspiciatis eius suscipit reprehenderit molestiae vitae similique.
Panel 3 header
Lorem ipsum dolor sit amet, consectetur adipisicing elit. Repellendus aliquid tempore natus voluptates repudiandae, eos dolorem libero inventore, quod incidunt, asperiores. Reiciendis itaque enim pariatur, blanditiis minima autem quo a nulla, obcaecati quis, excepturi atque ab rerum! Sequi molestias vel eum, hic, perspiciatis eius suscipit reprehenderit molestiae vitae similique.

Panel 4 header
Lorem ipsum dolor sit amet, consectetur adipisicing elit. Repellendus aliquid tempore natus voluptates repudiandae, eos dolorem libero inventore, quod incidunt, asperiores. Reiciendis itaque enim pariatur, blanditiis minima autem quo a nulla, obcaecati quis, excepturi atque ab rerum! Sequi molestias vel eum, hic, perspiciatis eius suscipit reprehenderit molestiae vitae similique.
Panel 4 header 2
Lorem ipsum dolor sit amet, consectetur adipisicing elit. Repellendus aliquid tempore natus voluptates repudiandae, eos dolorem libero inventore, quod incidunt, asperiores. Reiciendis itaque enim pariatur, blanditiis minima autem quo a nulla, obcaecati quis, excepturi atque ab rerum! Sequi molestias vel eum, hic, perspiciatis eius suscipit reprehenderit molestiae vitae similique.
Panel 5 header
Lorem ipsum dolor sit amet, consectetur adipisicing elit. Repellendus aliquid tempore natus voluptates repudiandae, eos dolorem libero inventore, quod incidunt, asperiores. Reiciendis itaque enim pariatur, blanditiis minima autem quo a nulla, obcaecati quis, excepturi atque ab rerum! Sequi molestias vel eum, hic, perspiciatis eius suscipit reprehenderit molestiae vitae similique.
Panel 5 header 2
Lorem ipsum dolor sit amet, consectetur adipisicing elit. Repellendus aliquid tempore natus voluptates repudiandae, eos dolorem libero inventore, quod incidunt, asperiores. Reiciendis itaque enim pariatur, blanditiis minima autem quo a nulla, obcaecati quis, excepturi atque ab rerum! Sequi molestias vel eum, hic, perspiciatis eius suscipit reprehenderit molestiae vitae similique.
Panel 5 header 3
Lorem ipsum dolor sit amet, consectetur adipisicing elit. Repellendus aliquid tempore natus voluptates repudiandae, eos dolorem libero inventore, quod incidunt, asperiores. Reiciendis itaque enim pariatur, blanditiis minima autem quo a nulla, obcaecati quis, excepturi atque ab rerum! Sequi molestias vel eum, hic, perspiciatis eius suscipit reprehenderit molestiae vitae similique.