Biacore X100 reference portal
Performance critera for concentration measurements
However concentration is measured, there is a set of standardized criteria that measure the performance of the assay within and between assay occasions. Documented performance is desirable in all concentration measurements, and is a requirement for validated assays used in quality control and other contexts. The standard performance criteria defined in the following sections are based on the ICH recommendations (International Conference on Harmonization of Technical Requirements for Registration of Pharmaceuticals for Human Use. Q2A Text on validation of analytical procedures (1994) and Q2B Validation of analytical procedures: Methodology (1996)).
The specificity of an assay is the ability to measure the concentration of analyte without interference from other components that might be present in the sample. Components that may interfere with the assay are typically impurities, degradation products or other matrix components. In the context of an interaction-based assay designed to measure functionally active analyte, inactive analyte molecules may also be considered as potential sources of interference.
Although the terms specificity and selectivity are sometimes used interchangeably they strictly have slightly different meanings. Specificity refers to the ability to measure a single analyte species to the exclusion of others, while selectivity refers to the ability to measure a class of analyte species without distinguishing the individual members of the class. In these terms, for example, an assay that is specific for folic acid will not detect the related molecule tetrahydrofolic acid, whereas an assay that is selective for folic acid derivatives may detect both. Narrow specificity in an assay is not necessarily a requirement: on the contrary, a broad selectivity is desirable for assays intended to measure classes of analytes.
Cross-reactivity is a quantitative measure of specificity and selectivity, and is expressed formally in terms of the ratio of the affinities of different analytes for the ligand or detecting molecule. In practice, cross-reactivity in an inhibition assay may be determined from the IC50 values for the analytes. In a direct assay, the observed response depends on the molecular weight of the analyte, and comparisons of B50 values must be made in terms of response divided by molecular weight. A compound that requires 100 times higher concentration to give the same molecular weight-corrected response as the B50 value for the analyte is said to show a cross-reactivity of 1%.
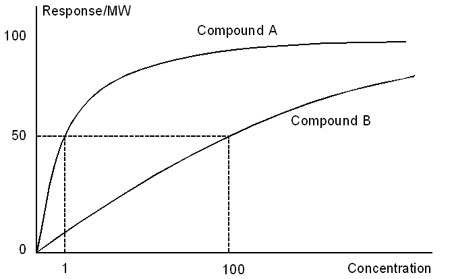
Cross-reactivity in a direct assay is determined from calibration curves of molecular weight-corrected response against concentration. In this illustration, compound B shows 1% cross-reactivity with compound A.
The accuracy of a concentration assay describes how well the measured concentrations agree with accepted reference values. The accuracy is determined from measurements made on standard samples in comparison either with the results of an independent reference assay or with quoted values for the standard. In this respect, it is relevant to remember that Biacore assays only measure analyte that is capable of binding to the ligand or detecting molecule: the same applies to all immunoassays but not to measurements based on e.g. determination of protein content. Discrepancies between results from Biacore and reference values may be observed if the reference assay is not based on the same kind of interaction as the Biacore assay. The significance of such discrepancies for acceptance of the assay performance must be assessed for each individual case.
Recovery is a term used in relation to the quantitation of accuracy, and refers to the correlation between the measured and expected amounts of analyte in samples spiked with known amounts.
The linearity of a concentration assay refers the ability of the assay to obtain response values that are related to the analyte concentration by a defined mathematical function. Ideally, the function should be linear, if necessary after an appropriate mathematical transformation of the data. For many interaction-based assays, however, a linear relationship cannot be obtained even after mathematical transformation, and in such cases it is acceptable that the relationship between response and analyte concentration is defined by an appropriate mathematical function. Evaluation of concentration measurements in Biacore offers a fully defined four-parameter equation for fitting a curve to the calibration data points.
In quantitative terms, linearity is expressed as the regression coefficient for fitting the data points to a straight line. This approach cannot be used in cases where a linear function is not available. An alternative is to plot the measured analyte concentrations against the expected (known) concentrations and determine the regression coefficient for fitting these points to a straight line. This plot of measured against expected concentrations should always be a straight line regardless of the shape of the function describing response against concentration.
The limit of detection (LOD) for a concentration assay is the lowest analyte concentration that can be detected but not necessarily quantitated as an exact value. For direct assays, the LOD is primarily a function of the signal-to-noise ratio in the measurement itself, and is set in relation to statistical variations in response values for blank samples. A commonly used value is 3 x SD, where SD is the standard deviation of replicate measurements on blank samples.
If the LOD is determined from measurements on blank samples (or from other means of measuring the noise level in the assay when no analyte is present), this parameter does not incorporate any factor relating to experimental variations in source, composition or preparation of samples. These aspects are included in the limit of quantitation.
Determination of the LOQ of a concentration assay requires that the precision and accuracy of the assay are measured over a range of analyte concentrations, in order to determine the concentrations above and below which the performance is acceptable. These concentrations are then the LOQs: different values may be applicable according to whether precision is determined as intermediate precision or reproducibility. (The LOQ should not be based on repeatability or intra-assay precision, since the value has little meaning in reference to a single assay occasion).
The lower limit of quantitation (LLOQ) is the lowest analyte concentration that can be measured with suitable precision and accuracy. The level corresponding to “suitable” is set according to the purpose and requirements of the assay.
The upper limit of quantitation (ULOQ) is the highest analyte concentration that can be measured with suitable precision and accuracy. There is no upper limit for assay procedures that do not impose restrictions on dilution factors involved in sample preparation: in some cases, however, sample preparation procedures may define a maximum permitted dilution, so that the assay will have an upper limit of quantitation.
Rigorous determination of the LOQ requires extensive measurements over a period of time and by different operators. Potential variation in other equipment such as pipettes, balances and volumetric flasks used in sample preparation as well as batch variation in reagents should also be taken into account. If the demands on documented assay performance are less stringent, a value 10 x SD (i.e. 3.3 x LOD), where SD is the standard deviation of replicate measurements on blank samples, may be used as an initial estimate of the LLOQ. This value can then be verified using a relatively small number of measurements on samples containing analyte. The unverified initial estimate should however never be quoted as a value for the LOQ.
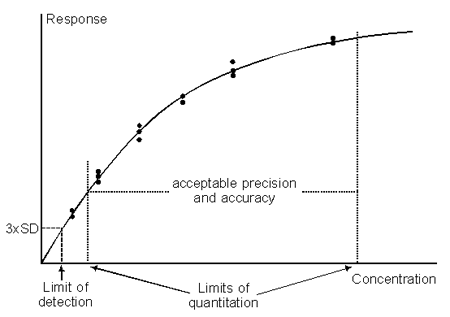
Limits of detection and quantitation.
The range of a concentration assay is the interval between (and including) the upper and lower limits of quantitation, i.e. the range within which the precision, accuracy and linearity are acceptable.
A parameter often quoted in relation to the range is the analyte concentration that gives 50% of the maximum response (B50 for a direct binding assay, IC50 for an inhibition assay). Note that this is not necessarily the mid-point of the concentration range, since the limits of quantitation are not the same as the minimum and maximum response.
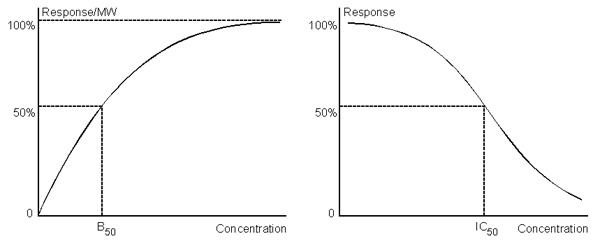
B50 (direct assays, left panel) and IC50 (inhibition assays, right panel) is the analyte concentration that gives 50% of the maximum response.
The robustness of a concentration assay is a measure of its capacity to remain unaffected by variations in method parameters. Robustness is related to intermediate precision or ruggedness. While intermediate precision refers to the effect of unintentional variations between assay occasions, operator robustness is determined by means of deliberate variations in chosen assay parameters. An assay that is robust with respect to all essential parameters will also have a high level of intermediate precision.
The sensitivity of a concentration assay is not included among the recommended performance criteria for validation, but is worthy of a definition here because the term is often used in several different and to some extent conflicting senses. Formally, sensitivity is defined as the assay response per unit analyte concentration (e.g. RU per µg/ml or RU/µM). This is the slope of the standard curve for the assay. For assays where the standard curve is not linear, the sensitivity varies with the analyte concentration. The term “sensitivity” is however sometimes used as a synonym for LOD or LOQ (the lowest concentration that can be detected or measured) or resolution (the smallest difference in concentration that can be determined with confidence). Biacore recommends usage of the term in the first sense (assay response per unit analyte concentration).
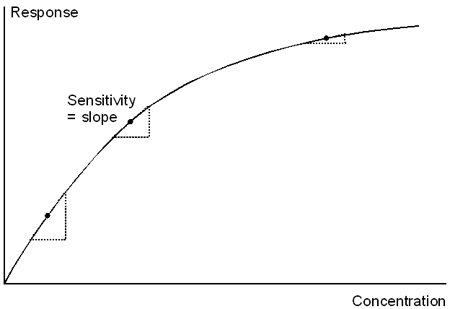
Sensitivity is the response per unit analyte concentration, which is the slope of the calibration curve. The sensitivity varies over the range of the assay if the calibration curve is not linear.
The precision of a concentration assay describes the agreement (degree of scatter) between result obtained from multiple measurements on the same homogeneous sample. Precision may be determined at three levels:
- Repeatability is the precision of the assay under the same operating conditions with the same sample over a short period of time (typically replicate measurements within the same experiment, also referred to as intra-assay precision).
- Intermediate precision is the precision within the same laboratory over different occasions, different operators, different individual assay instruments etc. Ruggedness is an alternative term for intermediate precision.
- Reproducibility is the precision between different laboratories (usually applied to collaborative studies in the standardization of methodology). Intermediate precision and reproducibility are two different aspects of inter-assay precision.
The precision of an assay is usually expressed in terms of the variance, standard deviation (SD) or coefficient of variation (CV) within the series of measurements. For a set of replicate measurements, the standard deviation is given by
![]()
where n = number of measurements
and y = response for a given measurement.
The coefficient of variation is given by
![]()
Statistical parameters for variation in measured results may be related to either dose or response values: this is perhaps most common in citations of CV values where the distinction is made between CVdose and CVresponse. The CVresponse value reflects the consistency of response values for a given concentration, while CVdose reflects the confidence with which a given response value can be related to analyte concentration. In general, CVdose values are high at the top and bottom of the measurement range (at the bottom because low responses are difficult to determine accurately, at the top because the standard curve flattens out at high concentrations), and are lowest in the middle of the range. CVresponse values, on the other hand, are frequently low even at the top of the dynamic range. CVdose is in general a better criterion of assay performance than CVresponse.
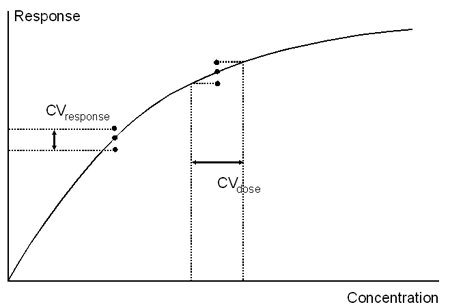
CVresponse is an indication of the variability in the response for a given analyte concentration. CVdose is an indication of the variability in calculated concentration derived from a given set of measurements.
Accuracy and precision are frequently confused in common parlance, although they are clearly distinguished in their formal definitions. An assay that is precise but not accurate will always give the same (wrong) answer, while one that is accurate but not precise will give an approximate but correct answer.
The response observed during the sample injection in Biacore results from a combination of analyte binding to the sensor surface and differences in bulk refractive index between the sample and running buffer.
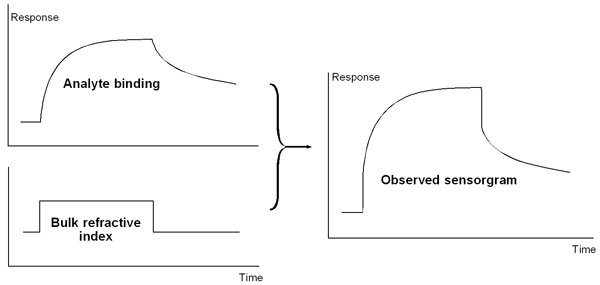
The observed response results from a combination of analyte binding to the sensor surface and differences in bulk refractive index between the sample and running buffer.
Careful matching of the buffer composition between sample and running buffer can help to reduce the bulk contribution, but exact matching is not necessary if the response is measured directly after the sample injection when the bulk contribution no longer applies. Place report points for measuring analyte response shortly (10-30 seconds depending on the rate at which analyte dissociates) after the sample injection. Report points should only be placed before the end of the injection if the analyte dissociates rapidly from the surface.
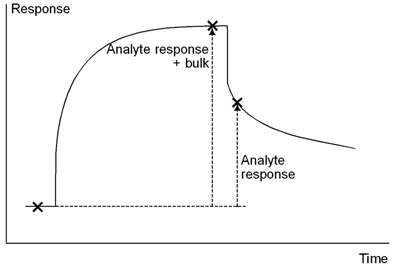
Place report points for measuring response after the sample injection so that the measured response is not affected by the bulk refractive index of the sample.
Binding rates measured from the slope at a report point are not affected by bulk refractive index considerations. Report points for binding rate measurements should be placed so that the window for slope determination is clear of any bulk refractive index contribution or other disturbances at the beginning of the sample injection.
Always place report points at identical positions on all sensorgrams for both calibration and unknown samples. If any of the report point values is invalidated by temporary disturbances in the sensorgram (such as air bubbles on the sensor surface), either eliminate that particular cycle from the evaluation or assign a different report point in all cycles. Do not move report points in some cycles but not in others.
Panel 2 header
Lorem ipsum dolor sit amet, consectetur adipisicing elit. Repellendus aliquid tempore natus voluptates repudiandae, eos dolorem libero inventore, quod incidunt, asperiores. Reiciendis itaque enim pariatur, blanditiis minima autem quo a nulla, obcaecati quis, excepturi atque ab rerum! Sequi molestias vel eum, hic, perspiciatis eius suscipit reprehenderit molestiae vitae similique.
Panel 3 header
Lorem ipsum dolor sit amet, consectetur adipisicing elit. Repellendus aliquid tempore natus voluptates repudiandae, eos dolorem libero inventore, quod incidunt, asperiores. Reiciendis itaque enim pariatur, blanditiis minima autem quo a nulla, obcaecati quis, excepturi atque ab rerum! Sequi molestias vel eum, hic, perspiciatis eius suscipit reprehenderit molestiae vitae similique.

Panel 4 header
Lorem ipsum dolor sit amet, consectetur adipisicing elit. Repellendus aliquid tempore natus voluptates repudiandae, eos dolorem libero inventore, quod incidunt, asperiores. Reiciendis itaque enim pariatur, blanditiis minima autem quo a nulla, obcaecati quis, excepturi atque ab rerum! Sequi molestias vel eum, hic, perspiciatis eius suscipit reprehenderit molestiae vitae similique.
Panel 4 header 2
Lorem ipsum dolor sit amet, consectetur adipisicing elit. Repellendus aliquid tempore natus voluptates repudiandae, eos dolorem libero inventore, quod incidunt, asperiores. Reiciendis itaque enim pariatur, blanditiis minima autem quo a nulla, obcaecati quis, excepturi atque ab rerum! Sequi molestias vel eum, hic, perspiciatis eius suscipit reprehenderit molestiae vitae similique.
Panel 5 header
Lorem ipsum dolor sit amet, consectetur adipisicing elit. Repellendus aliquid tempore natus voluptates repudiandae, eos dolorem libero inventore, quod incidunt, asperiores. Reiciendis itaque enim pariatur, blanditiis minima autem quo a nulla, obcaecati quis, excepturi atque ab rerum! Sequi molestias vel eum, hic, perspiciatis eius suscipit reprehenderit molestiae vitae similique.
Panel 5 header 2
Lorem ipsum dolor sit amet, consectetur adipisicing elit. Repellendus aliquid tempore natus voluptates repudiandae, eos dolorem libero inventore, quod incidunt, asperiores. Reiciendis itaque enim pariatur, blanditiis minima autem quo a nulla, obcaecati quis, excepturi atque ab rerum! Sequi molestias vel eum, hic, perspiciatis eius suscipit reprehenderit molestiae vitae similique.
Panel 5 header 3
Lorem ipsum dolor sit amet, consectetur adipisicing elit. Repellendus aliquid tempore natus voluptates repudiandae, eos dolorem libero inventore, quod incidunt, asperiores. Reiciendis itaque enim pariatur, blanditiis minima autem quo a nulla, obcaecati quis, excepturi atque ab rerum! Sequi molestias vel eum, hic, perspiciatis eius suscipit reprehenderit molestiae vitae similique.