Biacore X100 reference portal
Steady state affinity determination
Definition of affinity
The steady state phase (seen as a constant signal) provides information on the affinity of the interaction i.e. the strength of the binding. The affinity can also be determined from kinetic measurements. For a simple interaction, the equilibrium constant KD is the ratio of the rate constants kd/ka.
Affinity from steady-state
The value of the equilibrium dissociation constant (KD) is obtained by fitting a plot of response at equilibrium (Req) against the concentration. Steady-state affinity measurements are not affected by mass transport limitations since they are based on report points taken at equilibrium. To obtain a robust fit to a plot of Req against C for affinity determination, it is important that the range of analyte concentration is wide enough to reveal the curvature of the plot in full. In particular, if the highest concentration is too low in relation to the calculated KD value, the reported values will be uncertain even if the fit is apparently good and the chi-squared value is low.
Screen recording - Affinity, Strong & Weak Interaction
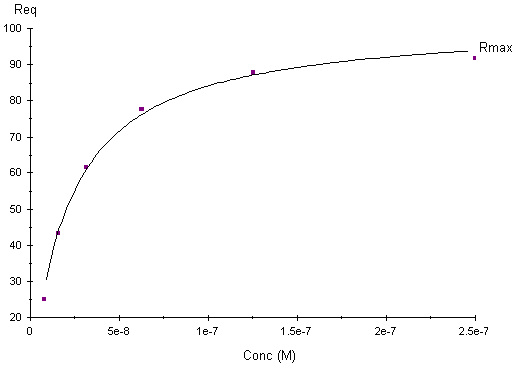
Plot of response at equilibrium (Req) against the concentration
At steady-state, the net rate of complex formation is zero:
so
Rearranging and setting R=Req (the equilibrium response level) gives:
Setting kd/ka=KD (the equilibrium dissociation constant) gives
The model calculates the equilibrium dissociation constant KD for a 1:1 interaction from a plot of steady state binding levels (Req) against analyte concentration (C). The equation includes a term for the bulk refractive index contribution RI, which is assumed to be the same for all samples. This term simply serves as an offset on the Req-axis.
The model parameters are:
|
Obtained from
|
||
|
KD
|
Equilibrium dissociation constant (M)
|
Fitted
|
|
Rmax
|
Analyte binding capacity of the surface (RU)
|
Fitted
|
|
Offset |
Bulk refractive index contribution in the sample
|
Fitted
|
|
|
||
Note that reported KD values that are higher than half the highest analyte concentration used should be treated with caution. If the response against concentration plot does not flatten out sufficiently because the concentrations are not high enough in relation to the KD value, the reported value may be unreliable.
In practice, it can be difficult to reach steady state particularly at the lower concentrations. If steady state is not reached the affinity will be underestimated – the extent of the error depends on how far from steady state the interaction is. In such cases, kinetic analysis can be more appropriate.
Affinity from kinetic analysis
The affinity constant KD is also obtained from kinetics analysis as the ratio of the rate constants ka and kd:
KD = kd / ka
Should I determine affinity from steady-state or kinetics?
Ideally, values determined from kinetics and from steady state measurements should be the same. In practice, these approaches are generally applicable in different situations that are often mutually exclusive: kinetics analysis can be used for sensorgrams that contain kinetic information but do not necessarily reach steady state, while determination from steady state measurements is most useful for interactions where the kinetics are too fast to measure with confidence but steady state is reached with relatively short injection times. If the interaction is a 1:1 binding but does not reach steady state, a more reliable value for KD may be obtained from kinetic evaluation.
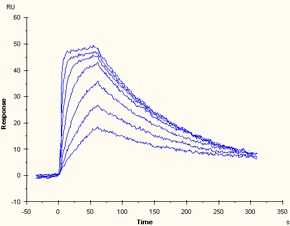 Data series that contains kinetic information but does not reach steady state |
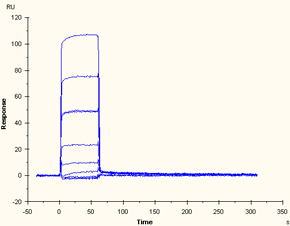 Data series that reaches steady state but is too fast to resolve kinetics |
Determination of affinity in solution provides an alternative to steady state affinity measurements for interactions that take a long time to reach equilibrium or for any other reason are difficult to determine with a direct binding assay. In principle, the affinity in solution approach uses Biacore to determine the free concentration of one interactant in equilibrium mixtures containing known total interactant concentrations.
Experimental setup
The interactants in affinity in solution determination are denoted A and B:
A + B = AB
Experiments are set up so that a fixed concentration of B is mixed with variable concentrations of A and allowed to reach equilibrium. The free concentration of B is then determined by injecting the sample over a ligand that binds B but not the complex AB (the interactant A or a derivative thereof is usually suitable as ligand). It is assumed that the measurement itself does not significantly disturb the equilibrium in the sample.
The experimental setup requires a calibration curve with known concentrations of B determined over the same sensor surface, in order to calculate the free B concentrations in the samples.
Evaluation principles
The calibration curve with known concentrations of B is used to calculate the free B concentrations in the samples.
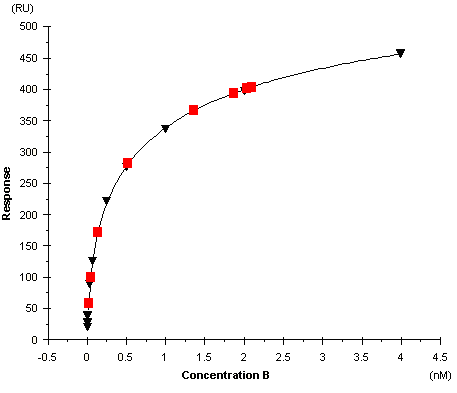
Calibration curve with known concentrations of B
In the plot of free B against total A, the equilibrium constant KD is given by the concentration of A at the inflection point in the fitted curve.
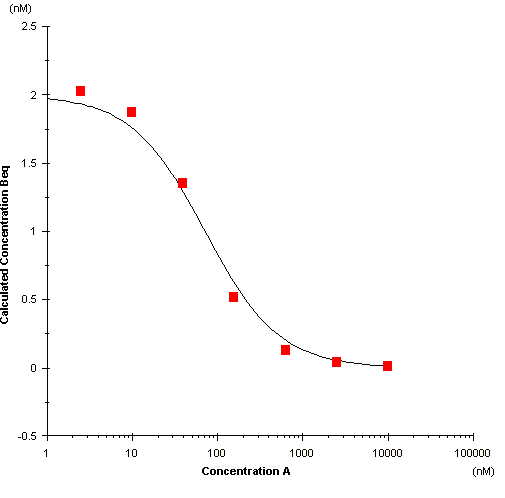
Plot of free B against total A
Equations
The equilibrium constant for a 1:1 interaction is given by
![]()
or
![]()
Rearranging gives
![]()
or
![]()
Solving for AB:
Substituting in the relationship Bfree = Btot – AB gives
This equation can be fitted to a plot of Bfree against Atot to calculate a value for KD.
Panel 2 header
Lorem ipsum dolor sit amet, consectetur adipisicing elit. Repellendus aliquid tempore natus voluptates repudiandae, eos dolorem libero inventore, quod incidunt, asperiores. Reiciendis itaque enim pariatur, blanditiis minima autem quo a nulla, obcaecati quis, excepturi atque ab rerum! Sequi molestias vel eum, hic, perspiciatis eius suscipit reprehenderit molestiae vitae similique.
Panel 3 header
Lorem ipsum dolor sit amet, consectetur adipisicing elit. Repellendus aliquid tempore natus voluptates repudiandae, eos dolorem libero inventore, quod incidunt, asperiores. Reiciendis itaque enim pariatur, blanditiis minima autem quo a nulla, obcaecati quis, excepturi atque ab rerum! Sequi molestias vel eum, hic, perspiciatis eius suscipit reprehenderit molestiae vitae similique.

Panel 4 header
Lorem ipsum dolor sit amet, consectetur adipisicing elit. Repellendus aliquid tempore natus voluptates repudiandae, eos dolorem libero inventore, quod incidunt, asperiores. Reiciendis itaque enim pariatur, blanditiis minima autem quo a nulla, obcaecati quis, excepturi atque ab rerum! Sequi molestias vel eum, hic, perspiciatis eius suscipit reprehenderit molestiae vitae similique.
Panel 4 header 2
Lorem ipsum dolor sit amet, consectetur adipisicing elit. Repellendus aliquid tempore natus voluptates repudiandae, eos dolorem libero inventore, quod incidunt, asperiores. Reiciendis itaque enim pariatur, blanditiis minima autem quo a nulla, obcaecati quis, excepturi atque ab rerum! Sequi molestias vel eum, hic, perspiciatis eius suscipit reprehenderit molestiae vitae similique.
Panel 5 header
Lorem ipsum dolor sit amet, consectetur adipisicing elit. Repellendus aliquid tempore natus voluptates repudiandae, eos dolorem libero inventore, quod incidunt, asperiores. Reiciendis itaque enim pariatur, blanditiis minima autem quo a nulla, obcaecati quis, excepturi atque ab rerum! Sequi molestias vel eum, hic, perspiciatis eius suscipit reprehenderit molestiae vitae similique.
Panel 5 header 2
Lorem ipsum dolor sit amet, consectetur adipisicing elit. Repellendus aliquid tempore natus voluptates repudiandae, eos dolorem libero inventore, quod incidunt, asperiores. Reiciendis itaque enim pariatur, blanditiis minima autem quo a nulla, obcaecati quis, excepturi atque ab rerum! Sequi molestias vel eum, hic, perspiciatis eius suscipit reprehenderit molestiae vitae similique.
Panel 5 header 3
Lorem ipsum dolor sit amet, consectetur adipisicing elit. Repellendus aliquid tempore natus voluptates repudiandae, eos dolorem libero inventore, quod incidunt, asperiores. Reiciendis itaque enim pariatur, blanditiis minima autem quo a nulla, obcaecati quis, excepturi atque ab rerum! Sequi molestias vel eum, hic, perspiciatis eius suscipit reprehenderit molestiae vitae similique.


