Causes of poor curve fit
This section identifies some of the common causes of poor curve fitting in kinetic evaluation.
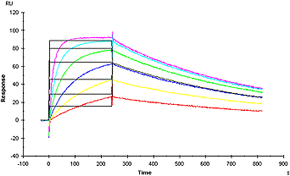
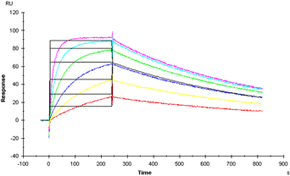
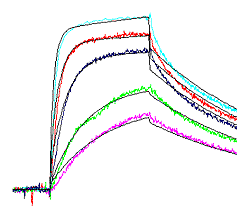
The experimental data used in the illustrations are taken from analysis of a simple 1:1 interaction. The results of fitting to the 1:1 interaction model are shown below for comparison with the other illustrations.
Incorrect analyte concentrations or misplaced samples
If the wrong analyte concentration values are entered for the sensorgrams, a poor fit will be obtained. Just two deviant curves with an acceptable fit for the remaining curves may indicate that the two concentrations have been reversed.
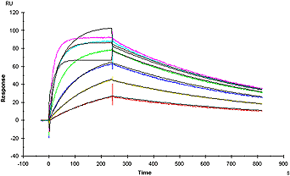
Fitting to sensorgrams with two analyte concentrations interchanged
Wrong order of magnitude of analyte concentrations
If concentrations are entered with an incorrect order of magnitude (e.g. entering 10 M instead of 10nM), the software may be unable to find a fit for the curves because the starting values for the fitting procedure are out of range.
Fitting to sensorgrams with analyte concentrations entered as molar instead of nanomolar
If the software is able to find a fit with the wrong order of magnitude for the analyte concentrations, the fit will be valid but an incorrect value will be obtained for the association rate constant ka. The dissociation rate constant kd is independent of analyte concentration and will not be affected.
Unsuitable model
Fitting data from a complex interaction to a simple model will give a more or less poor fit, depending on the nature and extent of the interaction complexity.
Note: Fitting data from a simple interaction to a complex model will generally not give a poor fit: however, some of the values obtained will lack significance. For example, fitting interaction-limited data to a mass-transport limited model will give the correct values for the interaction rate constants but the value for the mass transport constant will not be significant.
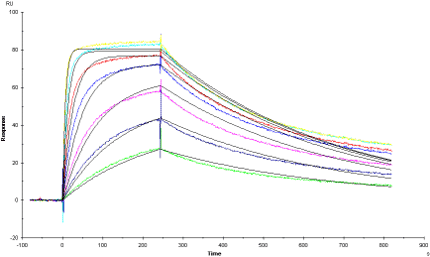
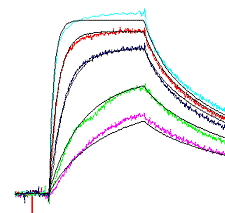
Fitting data from a complex interaction to the 1:1 interaction model
Inappropriate starting values
Fitting algorithms require starting values for all variables in the model. If the starting values provided differ too widely (usually by several orders of magnitude) from the best-fit values, the software may not be able to find a fit. This kind of error typically results in fitted curves that consist of a series of straight line segments which deviate greatly from the sensorgrams.
Fitting to a 1:1 interaction model with a starting value of 108 for ka (an acceptable starting value is in the range 101 -106)
If you observe this kind of behaviour, check first that the analyte concentration values are correct. If this does not help, try changing the starting values for ka and/or kd either up or down by a factor of 103 or more.
Inappropriate bulk response values
Most models assign a locally variable parameter RI to the bulk response. The algorithms used sometimes tend to assign unnecessarily high values to this parameter in the fitted curves. If you are evaluating data that has been properly reference-subtracted and find that the fitted curves show response shifts at the beginning and end of the injection, try setting the bulk response parameter to a constant value of 0.
 RI local variable |
 RI constant = 1 |
See also
Panel 2 header
Lorem ipsum dolor sit amet, consectetur adipisicing elit. Repellendus aliquid tempore natus voluptates repudiandae, eos dolorem libero inventore, quod incidunt, asperiores. Reiciendis itaque enim pariatur, blanditiis minima autem quo a nulla, obcaecati quis, excepturi atque ab rerum! Sequi molestias vel eum, hic, perspiciatis eius suscipit reprehenderit molestiae vitae similique.
Panel 3 header
Lorem ipsum dolor sit amet, consectetur adipisicing elit. Repellendus aliquid tempore natus voluptates repudiandae, eos dolorem libero inventore, quod incidunt, asperiores. Reiciendis itaque enim pariatur, blanditiis minima autem quo a nulla, obcaecati quis, excepturi atque ab rerum! Sequi molestias vel eum, hic, perspiciatis eius suscipit reprehenderit molestiae vitae similique.

Panel 4 header
Lorem ipsum dolor sit amet, consectetur adipisicing elit. Repellendus aliquid tempore natus voluptates repudiandae, eos dolorem libero inventore, quod incidunt, asperiores. Reiciendis itaque enim pariatur, blanditiis minima autem quo a nulla, obcaecati quis, excepturi atque ab rerum! Sequi molestias vel eum, hic, perspiciatis eius suscipit reprehenderit molestiae vitae similique.
Panel 4 header 2
Lorem ipsum dolor sit amet, consectetur adipisicing elit. Repellendus aliquid tempore natus voluptates repudiandae, eos dolorem libero inventore, quod incidunt, asperiores. Reiciendis itaque enim pariatur, blanditiis minima autem quo a nulla, obcaecati quis, excepturi atque ab rerum! Sequi molestias vel eum, hic, perspiciatis eius suscipit reprehenderit molestiae vitae similique.
Panel 5 header
Lorem ipsum dolor sit amet, consectetur adipisicing elit. Repellendus aliquid tempore natus voluptates repudiandae, eos dolorem libero inventore, quod incidunt, asperiores. Reiciendis itaque enim pariatur, blanditiis minima autem quo a nulla, obcaecati quis, excepturi atque ab rerum! Sequi molestias vel eum, hic, perspiciatis eius suscipit reprehenderit molestiae vitae similique.
Panel 5 header 2
Lorem ipsum dolor sit amet, consectetur adipisicing elit. Repellendus aliquid tempore natus voluptates repudiandae, eos dolorem libero inventore, quod incidunt, asperiores. Reiciendis itaque enim pariatur, blanditiis minima autem quo a nulla, obcaecati quis, excepturi atque ab rerum! Sequi molestias vel eum, hic, perspiciatis eius suscipit reprehenderit molestiae vitae similique.
Panel 5 header 3
Lorem ipsum dolor sit amet, consectetur adipisicing elit. Repellendus aliquid tempore natus voluptates repudiandae, eos dolorem libero inventore, quod incidunt, asperiores. Reiciendis itaque enim pariatur, blanditiis minima autem quo a nulla, obcaecati quis, excepturi atque ab rerum! Sequi molestias vel eum, hic, perspiciatis eius suscipit reprehenderit molestiae vitae similique.