Biacore X100 reference portal
Assay setup for regeneration scouting
Regeneration scouting is a procedure for finding potential conditions for regeneration, which can later be refined if necessary and tested more extensively.
Scouting procedure
Scouting is performed by testing a few (suggested 5) repeated cycles of analyte binding and regeneration attempt with each condition, and examining trends in the response levels within each condition.
Start scouting with the mildest conditions and progress towards more harsh treatment. This will reduce the risk that the surface is damaged in early scouting cycles and rendered useless for later tests. For scouting regeneration conditions of different types (e.g. pH and high ionic strength), run at least the initial scouting for each type on a new sensor surface to avoid complications that can arise from mixed treatments of the surface.
For example if regeneration with low pH is being tested, start at pH 3 or 2.5 and decrease the pH in steps of 0.5 or 0.25 units. Larger steps will involve fewer cycles to test a given range of pH values, but additional experiments may be needed to refine the conditions. A resolution of 0.25 pH units or less is recommended for fine-tuning of regeneration with acidic conditions.
Choice of regeneration solution
Follow the link at the bottom of this page for suggested regeneration solutions. If necessary, use your knowledge and experience of the ligand and analyte to guide your choice. For molecules used in affinity chromatography contexts, conditions for elution from the chromatographic medium can provide a starting point for regeneration scouting.
Choice of sensor surface
Use a sensor surface which is representative for the surface you intend to use in your experiments. Use ligand immobilized or captured at the same level as for the final experiments. Optimal regeneration conditions can in some cases vary with ligand level.
Surfaces used for regeneration scouting can seldom be re-used for analysis purposes, except in the fortunate circumstances where the last regeneration conditions tested are optimal or too mild. In planning regeneration scouting procedures, be aware that ligand used for a scouting series will probably not be useful for any further experiments.
Analyte solution
Where possible, use a high concentration of analyte so that at least half the maximum binding capacity of the surface is occupied. In general, interpretation of regeneration scouting is easier if high analyte levels are used, since trends in analyte response values are more readily detected.
Test regeneration conditions using analyte that reflects the experimental samples if possible. This is particularly important if the samples are complex mixtures such as cell culture medium or body fluids, where binding of non-analyte components to the surface can complicate the regeneration behavior.
Assess the regeneration scouting results
Assess the results in terms of trends in analyte response and baseline level within and between tested conditions.
Once regeneration scouting has given an indication of suitable conditions, you may want to verify the performance of regeneration over a larger number of repeated cycles of analyte injection and regeneration, depending on the number of cycles you intend to use in the assay.
Even if the nature of the ligand-analyte interaction is probably the major factor determining suitable regeneration conditions, the optimum conditions are affected by the surface properties, ligand density and analyte binding levels.
Sensor chip type
Optimal regeneration conditions can differ slightly for the same ligand-analyte pair on different sensor chip types. In a test study using anti-myoglobin antibodies as ligand and myoglobin as analyte, optimal regeneration with glycine-HCl on Sensor Chip CM3 required pH values 0.2–0.4 units lower than on Sensor Chip CM5.
Coupling chemistry
Regeneration properties of the same ligand immobilized on the same sensor chip type can differ slightly with different coupling chemistries.
Immobilization level
The amount of immobilized ligand can have a significant effect on the optimal regeneration conditions. Monoclonal antibodies regenerated with glycine-HCl, for example, have been found to require lower pH values at lower ligand densities. The effect can be as much as 0.5 pH units between 600 and 10,000 RU immobilized antibody.
Analyte binding level
The amount of analyte bound to the surface can affect the conditions required for optimal regeneration. In general, higher analyte levels require slightly harsher conditions.
Temperature
Temperature can have a significant effect on regeneration performance, and it is important that regeneration is optimized and tested at the temperature at which the assay will be run.
Determining suitable regeneration conditions is basically a two-step process:
- Regeneration scouting for possible conditions
- Verification of the suitability of chosen conditions
In some cases, conditions found in the initial scouting may need to be fine-tuned in additional experiments before verification. A set of reagents suitable for regeneration scouting with most protein ligands is available as Regeneration Scouting Kit from Cytiva.
Once regeneration scouting has given an indication of suitable conditions, you may want to verify the performance of regeneration over a larger number of repeated cycles of analyte injection and regeneration, depending on the number of cycles you intend to use in your assay.
The criterion of acceptance for the regeneration conditions will depend to some extent on the demands of the application: for example, careful kinetic analyses demand more rigorous regeneration than qualitative screening for binders and non-binders.
Note that there is often a slight reduction in surface activity during the first few cycles on a new surface. Exclude the first cycles from your assessment of regeneration if the surface is newly prepared.
Baseline and response changes
The goal of regeneration is to remove all bound analyte while leaving the ligand undamaged. Because of the way scouting experiments are usually constructed, the response levels (baseline and analyte response) in one cycle report on the efficiency of regeneration in the previous cycle (figure below).
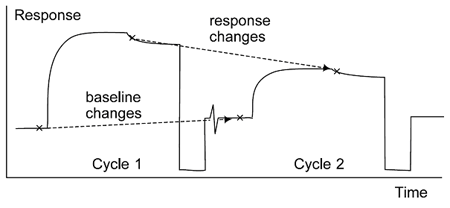
Regeneration scouting is assessed by following the effects of regeneration attempts on the analyte binding capacity and baseline levels. The measurements from one cycle in the scouting procedure report on the efficiency of the regeneration attempt in the previous cycle.
For the first cycle of regeneration scouting, the surface has not yet been exposed to any regeneration attempt. The analyte response correspondingly provides a starting reference for the level of binding that may be expected. Thereafter, the baseline report point indicates whether analyte has been removed from the surface in the previous regeneration cycle, while the analyte response indicates whether the ligand retains analyte-binding activity.
Too mild regeneration conditions
Regeneration conditions which do not remove analyte sufficiently lead to an increase in baseline between cycles with a corresponding decrease in analyte binding response measured relative to the baseline in the same cycle (figure below).
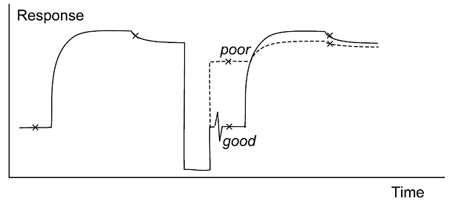
Inefficient regeneration leaves analyte on the surface (top panel), seen as an increase in the baseline.
Too harsh regeneration conditions
Conditions which are too harsh may remove all bound analyte but result in a loss of analyte binding capacity as the ligand activity deteriorates (figure below).
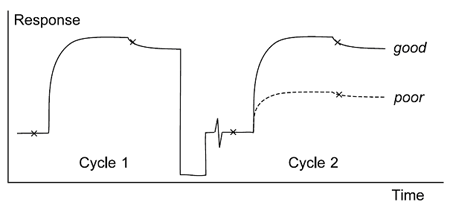
Efficient regeneration removes all bound analyte. The analyte response in the second injection reveals whether the ligand is still fully active.
Assess the regeneration performance
Assess the regeneration performance in the first place from trends in the analyte response both within and between tested conditions. Trends in the baseline level are seldom conclusive in themselves, but may provide complementary information to aid in interpretation of the analyte response.
The following general guidelines apply:
- The sample binding response should be constant. A falling trend in sample response indicates either that the ligand is losing activity (regeneration is too harsh) or that material is accumulating on the surface (regeneration is too mild).
- The baseline after regeneration should not increase. If it does, this indicates that material is accumulating on the surface (regeneration is too mild). Some increase in baseline may however be tolerated provided that the analyte binding response is not affected.
- The baseline level after regeneration may fall, particularly during the first few cycles using a newly prepared chip. This is acceptable provided that the analyte response is not affected.
Schematic example of interpretation
A schematic example of regeneration scouting using four conditions is illustrated in the figure below. The first condition tested (A) is too mild: the sample response is consistently low and the baseline is consistently high, indicating that analyte bound in the first cycle is not removed. The second condition tested (B) shows some improvement, but the progressively increasing sample response indicates the analyte binding capacity is not completely restored by one regeneration injection of this solution. Condition C gives a stable level of both sample response and baseline, while condition D results in progressive deterioration of the analyte binding capacity. C is the best of these four conditions, while D is too harsh.
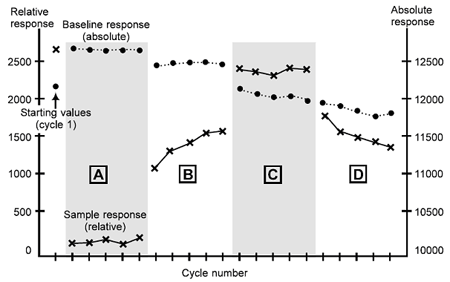
Scouting for regeneration conditions. The report points from the first cycle give the starting values: thereafter the points are grouped according to the regeneration conditions tested. See text for interpretation. • = baseline response; x = sample response.
Deviation from ideal performance
In practice, observed behavior in regeneration scouting may deviate from the ideal in a number of aspects:
- After efficient regeneration, the analyte response should in principle be the same as that in the first cycle, before exposure to any regeneration conditions. In practice, the response after regeneration often differs from the first value, and a consistent analyte response during repeated cycles of binding and regeneration is more important than achieving the same response as in the first cycle. The analyte binding capacity is often seen to deviate by 5–10% during the first few cycles on a newly prepared sensor chip, and start-up cycles should normally be included in assay protocols to compensate for this. Provided that only a relatively small fraction of the activity is lost in the first few cycles and that analyte response in subsequent cycles maintains a constant level, this effect may be ignored.
- When regeneration conditions are too mild and analyte accumulates on the surface, progressive recovery of analyte binding capacity over a few cycles with harsher conditions may be observed. This is usually an indication that the conditions are on the borderline between too mild and acceptable.
- Trends in the baseline level often do not follow the ideal pattern and are of secondary value in interpreting the results. As long as the analyte response relative to baseline is constant, trends in the absolute baseline level can usually be ignored if the changes are not excessive. A slight downward drift in baseline is common, even with fully optimized regeneration conditions.
- While trend plots provide a convenient overview of the regeneration performance in a scouting experiment, the sensorgrams from each cycle contain more information about the effect of regeneration conditions. Preparing overlay plots of the sample injection and dissociation phase from the regeneration scouting cycles can help to reveal changes in the interaction behavior that might be missed in a trend plot (for example a change in the dissociation rate of the analyte). For critical experiments such as high resolution kinetic measurements, the sensorgram shape should not be affected by the regeneration treatment.
The following case studies showing regeneration scouting for three different monoclonal antibody-antigen interactions with low pH illustrate interpretation of regeneration scouting in practice. Solutions used in each case were 10 mM glycine-HCl at pH 3.0, 2.5, 2.0 and 1.5. The antibody is immobilized on the surface as ligand.
Only trends in the analyte response level are shown: these are sufficient in all cases for interpreting the results.
Case 1
This antibody requires pH values below 3 for regeneration, but tolerates conditions down to pH 1.5 or below.
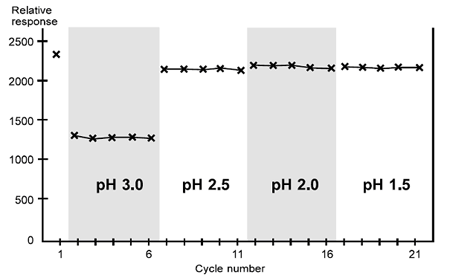
Scouting for regeneration conditions, case 1. This ligand tolerates a range of acidic conditions and can be regenerated at pH between 1.5 and 2.5.
The low analyte responses obtained with pH 3.0 suggest that these conditions are too mild. This is supported by the observations that longer injections give more efficient regeneration and that harsher conditions restore analyte binding capacity (not illustrated).
All the harsher conditions tested restore analyte responses to a constant level which is 90% or more of the response in the first cycle. Regeneration is thus achieved at pH 2.5 or below: regeneration can be performed confidently at pH 2.0, allowing a margin of variation in the behavior of different samples. There is no need to fine-tune the conditions further.
Case 2
This antibody can be regenerated at pH 2.0–3.0 (or possibly higher), but begins to lose activity at pH 1.5.
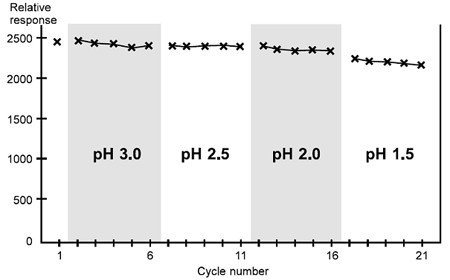
Scouting for regeneration conditions, case 2. This ligand begins to lose activity significantly at pH 1.5.
Satisfactory regeneration is obtained at pH 3.0 and pH 2.5. There is a slight loss of analyte response at pH 2.0, and progressive deterioration in the response is pronounced at pH 1.5 suggesting that this antibody surface does not tolerate conditions below pH 2.0. It may be possible to use even milder conditions than pH 3.0.
Case 3
This antibody presents a difficult case: none of the regeneration conditions tested is satisfactory, and scouting should be pursued further either with closer pH intervals around 2.5 and varying contact times or with a different regeneration approach.
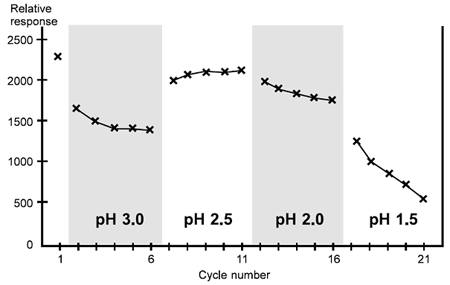
Scouting for regeneration conditions, case 3. For this ligand, it may be possible to find suitable regeneration conditions by further scouting around pH 2.5.
In this case, pH 3.0 is too mild since the analyte response falls progressively. The response is largely restored at pH 2.5, although a stable level is not reached until the third cycle at this pH. Lower pH values cause progressive deterioration in the response.
This antibody shows considerably less tolerance in regeneration conditions than the previous two cases, and for optimal performance the conditions should be refined further around pH 2.5.
Panel 2 header
Lorem ipsum dolor sit amet, consectetur adipisicing elit. Repellendus aliquid tempore natus voluptates repudiandae, eos dolorem libero inventore, quod incidunt, asperiores. Reiciendis itaque enim pariatur, blanditiis minima autem quo a nulla, obcaecati quis, excepturi atque ab rerum! Sequi molestias vel eum, hic, perspiciatis eius suscipit reprehenderit molestiae vitae similique.
Panel 3 header
Lorem ipsum dolor sit amet, consectetur adipisicing elit. Repellendus aliquid tempore natus voluptates repudiandae, eos dolorem libero inventore, quod incidunt, asperiores. Reiciendis itaque enim pariatur, blanditiis minima autem quo a nulla, obcaecati quis, excepturi atque ab rerum! Sequi molestias vel eum, hic, perspiciatis eius suscipit reprehenderit molestiae vitae similique.

Panel 4 header
Lorem ipsum dolor sit amet, consectetur adipisicing elit. Repellendus aliquid tempore natus voluptates repudiandae, eos dolorem libero inventore, quod incidunt, asperiores. Reiciendis itaque enim pariatur, blanditiis minima autem quo a nulla, obcaecati quis, excepturi atque ab rerum! Sequi molestias vel eum, hic, perspiciatis eius suscipit reprehenderit molestiae vitae similique.
Panel 4 header 2
Lorem ipsum dolor sit amet, consectetur adipisicing elit. Repellendus aliquid tempore natus voluptates repudiandae, eos dolorem libero inventore, quod incidunt, asperiores. Reiciendis itaque enim pariatur, blanditiis minima autem quo a nulla, obcaecati quis, excepturi atque ab rerum! Sequi molestias vel eum, hic, perspiciatis eius suscipit reprehenderit molestiae vitae similique.
Panel 5 header
Lorem ipsum dolor sit amet, consectetur adipisicing elit. Repellendus aliquid tempore natus voluptates repudiandae, eos dolorem libero inventore, quod incidunt, asperiores. Reiciendis itaque enim pariatur, blanditiis minima autem quo a nulla, obcaecati quis, excepturi atque ab rerum! Sequi molestias vel eum, hic, perspiciatis eius suscipit reprehenderit molestiae vitae similique.
Panel 5 header 2
Lorem ipsum dolor sit amet, consectetur adipisicing elit. Repellendus aliquid tempore natus voluptates repudiandae, eos dolorem libero inventore, quod incidunt, asperiores. Reiciendis itaque enim pariatur, blanditiis minima autem quo a nulla, obcaecati quis, excepturi atque ab rerum! Sequi molestias vel eum, hic, perspiciatis eius suscipit reprehenderit molestiae vitae similique.
Panel 5 header 3
Lorem ipsum dolor sit amet, consectetur adipisicing elit. Repellendus aliquid tempore natus voluptates repudiandae, eos dolorem libero inventore, quod incidunt, asperiores. Reiciendis itaque enim pariatur, blanditiis minima autem quo a nulla, obcaecati quis, excepturi atque ab rerum! Sequi molestias vel eum, hic, perspiciatis eius suscipit reprehenderit molestiae vitae similique.